- Developers
- Sygic Maps API
- Maps API
- Raster Maps JS
- Custom layers
Custom layers
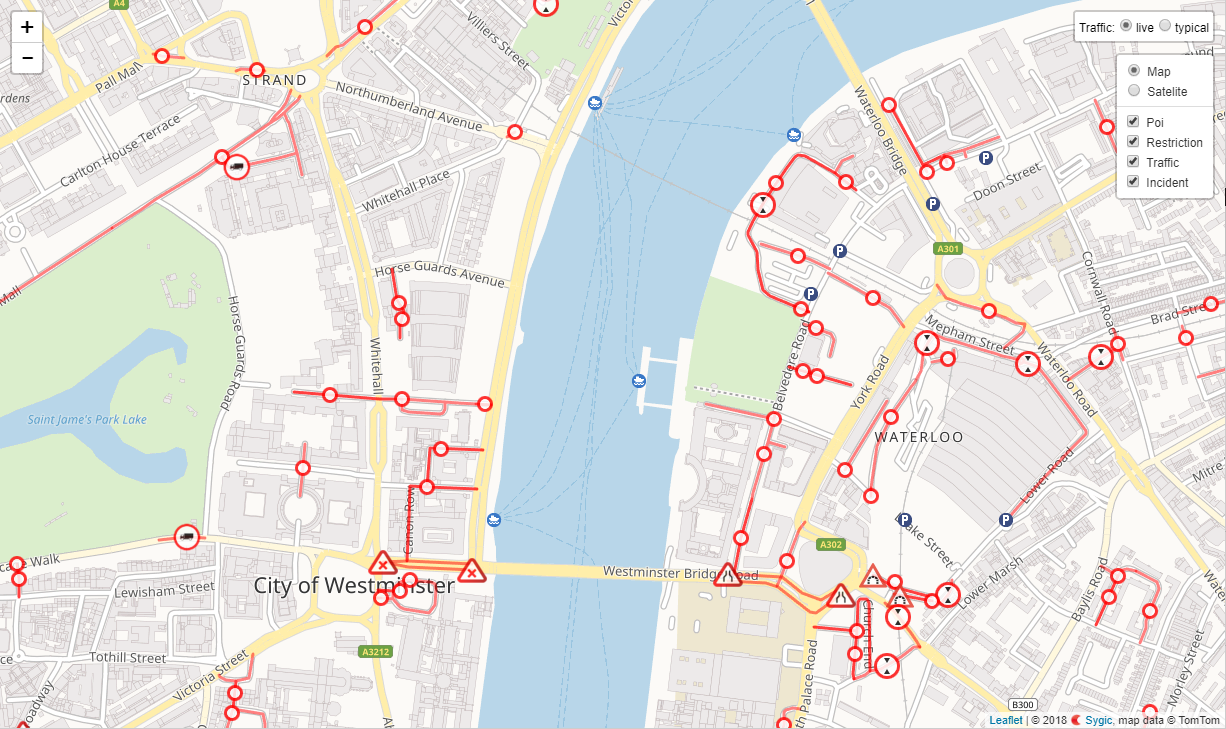
To achieve clean and readable map style, not all features are present by default and must be enabled manually when required. This feature is called "custom layers". You can use it to display:
- Points of interest (POIs) relevant to logistics and transportation - such as petrol stations, toll gates, etc.
- Restrictions for trucks - such as maximum weight, length, height, width restrictions, restrictions for hazardous materials etc.
- Traffic information
Example
This example demonstrates the use of the map layers. Click on icons to see code on Github or play with it in JSFiddle:

POI layer:

Basic usage is to simply display POIs from all the categories on appropriate zoom levels, as icons with tooltips.
L.TileLayer.sygicPoi('yourAPIkey').addTo(map);POI layer is supported only on 11+ zoom.
Restrictions layer
Basic usage is to simply display restrictions from all the categories on appropriate zoom levels, as icons with tooltips.
L.TileLayer.sygicRestriction('yourAPIkey').addTo(map);Restriction layer is supported only on 14+ zoom.


Enable only certain categories:
If you do not want to include all the POI or restriction categories, you can specify the subset as string array:
L.TileLayer.sygicPoi(
    'yourAPIkey', {
        categories: [
           'PetrolStation', 'TruckStop'
        ]
    }).addTo(map);

L.TileLayer.sygicRestriction(
    'yourAPIkey', {
        categories: [
           'HazmatGeneral', 'MaxWeightTotal', 'MaxWeightPerAxle'
        ]
}).addTo(map);| Option | Data type | Values | Descripion |
| categories (POI layer) |
array of strings | PetrolStation, FerryTerminal, TruckStop, WeightStation, FrontierCrossing, OpenParkingArea, TollGate, BusinessPark, Airport, RestArea, WarehouseFacility, MountainPass | Categories to include in POI layer. |
| categories (Restriction layer) |
array of strings | NoCar, NoTruck, HazmatGeneral, HazmatExplosiveMaterial, HazmatHarmfulToWater, MaxWeightTotal, MaxWeightPerAxle, MaxLength, MaxWidth, MaxHeight | Categories to include in Restriction layer. |
Traffic layer
To display real-time or typical traffic visualization on appropriate zoom levels, just add traffic layer to the map:
L.TileLayer.sygicTraffic('yourAPIkey').addTo(map);By default, the visual controller is shown on top-right corner of the map, which allows switching between real-time and typical traffic visualizations and in the case of typical traffic, it allows to select appropriate day of week and time of day of typical traffic visualization.
The default behaviour of the traffic layer and the traffic layer controller can be customized by options object, added as a second parameter to the L.TileLayer.sygicTraffic factory function:
L.TileLayer.sygicTraffic(
    'yourAPIkey', {
        traffic: {
            type: 'live',
            dayOfWeek: 1,
            timeOfDay: 8 * 60 * 60 * 1000
        },
        autoRefreshDelay: 120000,
        trafficControl: true,
        trafficControlOptions: {
            position: 'topright',
            titleText: 'Traffic:',
            liveTrafficText: 'live',
            typicalTrafficText: 'typical',
            dayNames: ['Sunday', 'Monday', 'Tuesday', 'Wednesday', 'Thursday', 'Friday', 'Saturday'],
            firstDay: 1
        }
    }).addTo(map);
Options
| Option | Data type | Values | Descripion |
| traffic.type | string | live typical |
The type of traffic to show. Live stands for real-time traffic, typical is for typical traffic. Default value is "live". |
| traffic.dayOfWeek | number | from 0 (Sunday) to 6 (Friday) | The day of week for which is the typical traffic displayed. Default value is 1 |
| traffic.timeOfDay | number | from 6 * 60 * 60 * 1000 (6:00AM) to 22 * 60 * 60 * 1000 (10:00PM) |
The time of day (in milliseconds) for which is the typical traffic displayed, default value is for 8:00AM. |
| autoRefreshDelay | number | The time (in miliseconds) for refresh live traffic. Default value is 120 000 ( 2 min) |
|
| trafficControl | boolean | true, false | If true, visual traffic controller is shown on top of the map. If false, no traffic control is displayed. |
| trafficControlOptions.position | string | 'topleft', 'topright', 'bottomleft' ,'bottomright' | The position of the control (one of the map corners). |
| trafficControlOptions.titleText | string | The title text displayed in the traffic controller. Default value is 'Traffic:' |
|
| trafficControlOptions.liveTrafficText | string | The text displayed for real-time traffic radio button. Default value is 'live'. |
|
| trafficControlOptions.typicalTrafficText | string | The text displayed for typical traffic radio button. Default value is 'typical'. |
|
| trafficControlOptions.dayNames | array of strings | ['Sunday', 'Monday', 'Tuesday', 'Wednesday', 'Thursday', 'Friday', 'Saturday'] | An array of day names displayed in day-of-week selection of typical traffic control. |
| trafficControlOptions.firstDay | string | from 0 (Sunday) to 6 (Friday) | The first day of week for the day-of-week selection of typical traffic control. Default value is 1'. |
The predefined traffic controller for custom use cases need not be used at all. For such use cases there is a setTraffic API function, which could be called from your custom JavaScript code:
//create the traffic layer without the controller
var trafficLayer = L.TileLayer.sygicTraffic('yourAPIkey', { trafficControl: false });
//add layer to the map - default (real-time) traffic will be shown
trafficLayer.addTo(map);

//wait 10 seconds and then show typical traffic on Sunday at 10:00AM
setTimeout(function () {
    trafficLayer.setTraffic('typical', 0, 10 * 60 * 60 * 1000);
}, 10000);| Function | Returns | Descripion |
| setTraffic( type, dayOfWeek, timeOfDay) | Show the traffic defined by function parameters; type - the type of traffic as string to show, 'live' and 'typical' values are possible, 'live' stands for real-time traffic, 'typical' is for typical traffic; dayOfWeek - the day of week as number for which is the typical traffic displayed, possible values are from 0 (Sunday) to 6 (Friday); timeOfDay - the time of day (in milliseconds) as number for which is the typical traffic displayed, default value is for 8:00AM, possible values are from 6 * 60 * 60 * 1000 (6:00AM) to 22 * 60 * 60 * 1000 (10:00PM). |
Incident layer
To display real-time incidents on appropriate zoom levels, just add incident layer to the map:
L.TileLayer.sygicIncident('yourAPIkey').addTo(map);If you do not want to include all incident categories, you can specify the subset of categories as string array in the options object:
L.TileLayer.sygicIncident('yourAPIkey', { categories: [ 'Accident', 'Closure', 'RoadWorks' ] } ).addTo(map);For now, all availabe categories include: Accident, Activity, AdditionalInfo, Closure, DangerousVehicle, ExceptionalLoad, LaneClosure, Obstacle, ParkingRestrictions, RoadConditions, RoadWorks, SizeAndWeightLimits, TrafficEquipment, TunnelBlocked, Visibility, Weather, Wind.
It is possible to set up refresh time for incidents as number in milliseconds. Example below shows refresh time setup for 120000 milliseconds (2 min).
L.TileLayer.sygicIncident('yourAPIkey', { autoRefreshDelay: 120000 } ).addTo(map);
For more advanced usage of Leaflet and its many plugins, refer to the Leaflet documentation page.
Custom layers work best with desktop versions of the following browsers browsers:
- Chrome
- Firefox
- Safari 5+
- Opera 12+
- IE 7–11
- Previous article: Map tile layers
- Next article: Controls